
A Simple Way To Track Marketing Activities In Your Cleaning Business

Many home cleaning business owners try a variety of ways to market their business. In the beginning it's usually a hit or miss approach -- try something to see if it works. And surprisingly many of these same business owners don't track the results of their marketing campaigns. I guess they figure they'll instinctively know what's working and what's not.
Instead of going on instinct when it comes to marketing, it's better to track real results so you don't continually put your hard earned money into an activity that doesn't generate a return on your investment.
A simple way to do this is to create a spreadsheet that lists your marketing activities in your cleaning business.
A spreadsheet allows you to break down your cost per lead and cost per conversion so you know which activity is most cost effective.
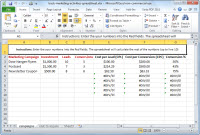
Here is a sample spreadsheet you could create, along with some sample numbers.

Begin by listing each marketing campaign and how much money you have invested in each. Next list leads and conversions. Leads are people that contacted you in response to the campaign. Conversions are people that actually made a purchase.
Calculate CPL (cost per lead) and CPC (cost per conversion). The last column is your conversion percentage. Looking at the three examples, the newsletter coupon had the best ROI (return on investment). The cost per lead and cost per conversion was less than the other two marketing campaigns and the conversion percentage was higher.
Now that you have a better understanding of what marketing campaigns have the best conversion rates, let's take it a step further and figure out your marketing budget and your CTA (cost to acquire a new client).
In this example you'll create a new worksheet, where you'll transfer over some of the numbers you figured out in the first part of this article.
Start by entering a sales goal. Let's say you want to increase sales this year by $50,000 (keeping in mind that the numbers generated here are to reach this goal - it does not take into consideration existing sales and customer attrition).
Next, you'll need to figure out your average yearly client value. Let's say that number is $2500 per year. The next two numbers you'll need will come from the first worksheet - Average Conversion Percentage and Average Cost per Lead (CPL).
In our example below, the calculations show that you'll need 20 new clients to reach the $50,000 goal (20 x $2500 = $50,000). You'll also need about 27 leads to reach your sales goal since your average conversion rate is 75% (20 ÷ .75 = 26.67).

Your yearly marketing budget to reach your sales goal is $2667 -- leads x avg. cost per lead (26.67 x $100 = $2667).
Your marketing budget as a percent of the sales goal is 5.33%, and your cost to acquire a new client (CTA) is $133 -- yearly marketing budget divided by new clients needed ($2667 ÷ 20 = $133).
 |
Worksheet Download In order to make this process easier to understand, we have created the spreadsheets for you. Visit the Download Library to download the Track Marketing Activities spreadsheet. Within the spreadsheet are two worksheets. The first tab is called "campaigns" and the second tab is called "cost to acquire". By using these tracking worksheets, you'll make wiser choices when it comes to deciding where to put your marketing dollars. |
To see how to use the spreadsheet, watch the short video.